How Bad Debt & Disposition Habits Kill Real Estate Returns
Note: This post is going to be a little more in depth than most. Some nerdy finance stuff ahead, proceed with caution. You’ve been warned…

Note: This post is going to be a little more in depth than most. Some nerdy finance stuff ahead, proceed with caution. You’ve been warned…
It might surprise some readers how often debt comes as an afterthought in CRE. After all, it’s the asset management that’s the real value driver in this business. The debt is just the means to an end, you’re not going to significantly alter the outcome of the transaction as long as you get the right LTV and interest rate to make the acquisition work, right?
Well, yes and no. Yes, asset management is the primary value driver in real estate, but the effects of debt management cannot be ignored in CRE’s operating profitability. In fact, let’s quantify the effects that bad debt management can have on a single deal’s profitability.
The Setup
Before joining the tech industry, I worked in a traditional consulting role in interest rate risk management for commercial real estate. One client of ours wanted to audit their debt management performance for the assets they sold during the last 5 years or so. My firm was engaged to evaluate whether they had made the correct interest rate/hedging decisions given hindsight and the information they had available at the time.
It’s important to understand that this company was NOT struggling. In fact, they had been killing it and was one of the more successful real estate firms in the country. But like all successful firms, they were interested in seeing how they could have done even better.
The Pattern
The first thing we did to evaluate their performance was to find out if their rate structures were efficient. This firm was pretty conservative when it came to interest rates, and preferred long-term, fixed rate loans. The vast majority of their loans were fixed rate, and nearly all had 7–10 year maturities.
In contrast, the average hold period for this firm was only 4–5 years. This meant that all of their dispositions over the previous 5 years had involved some sort of prepayment penalty. Additionally, since fixed rates are generally locked based on the outstanding treasury rates at the time, they had also locked in a higher interest rate than if they had financed for a shorter period of time.
Quantifying the Result
For this client, it just so happened that their median hold time was about 5 years, while the median financing term was 10 years. I can’t recall the median cost per deal, so let’s run our own analysis, using a generic $25M 10x30 loan.
We’re going to follow the same pattern as illustrated above, and sell an imaginary asset from July 2017 to July 2022, that we had closed on 5 years prior using 10Yr, fixed rate debt that we locked at 2.50% + 10T. There’s 2 values we’re interested in:
- Prepayment Penalty — What would the prepayment have been for having to prepay our imaginary loan 5 years early?
- Excess Interest Expense — How much had we overpaid in interest over the first 5 years of the loan by closing on a 10 year rate instead of a 5 year rate?
The astute among you might have noted that I didn’t include a difference in loan spreads across 5 and 10 year loans. I haven’t found a good source of data for that to create a basis between 5 and 10 yr lending spreads, but it would really just serve to inflate our excess interest expense, since 5 years spreads will be lower than 10 year spreads.
Prepayment Penalty
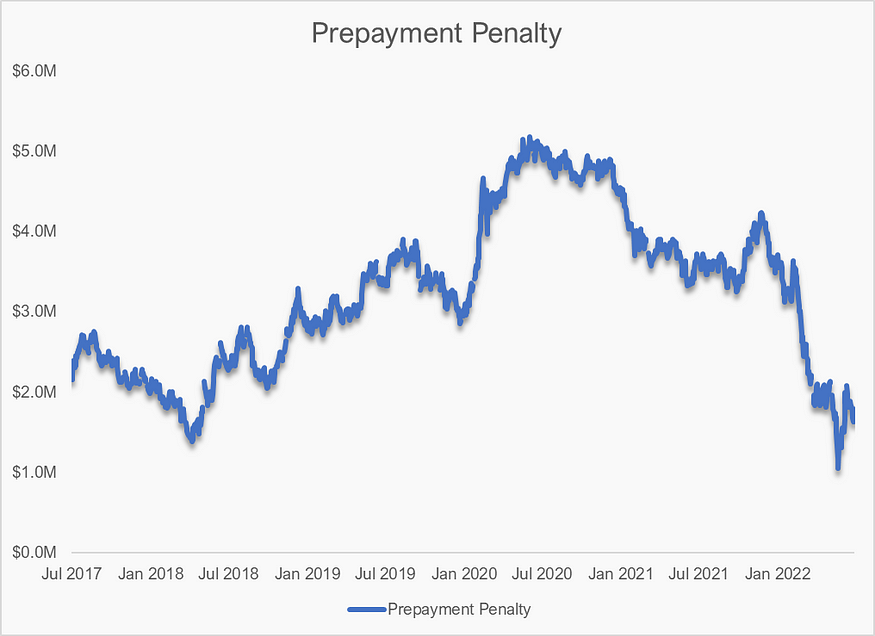
Average Penalty: $3.25M
This is the biggest line item in this scenario. Across the 5 years we analyzed, our generic loan would have cost us an average of $3.25M to prepay. This is because we have to discount the remaining 5 years of payments using the outstanding 5 year treasury rate. The average rate we would have locked over the time period was 4.69%, and the average discount rate was 3.02%.
You can see the prepayment penalty below over time, increasing as rates fell leading up to the pandemic in 2020 and falling again as the Fed battled inflation with higher rates in 2022.
Excess Interest Expense
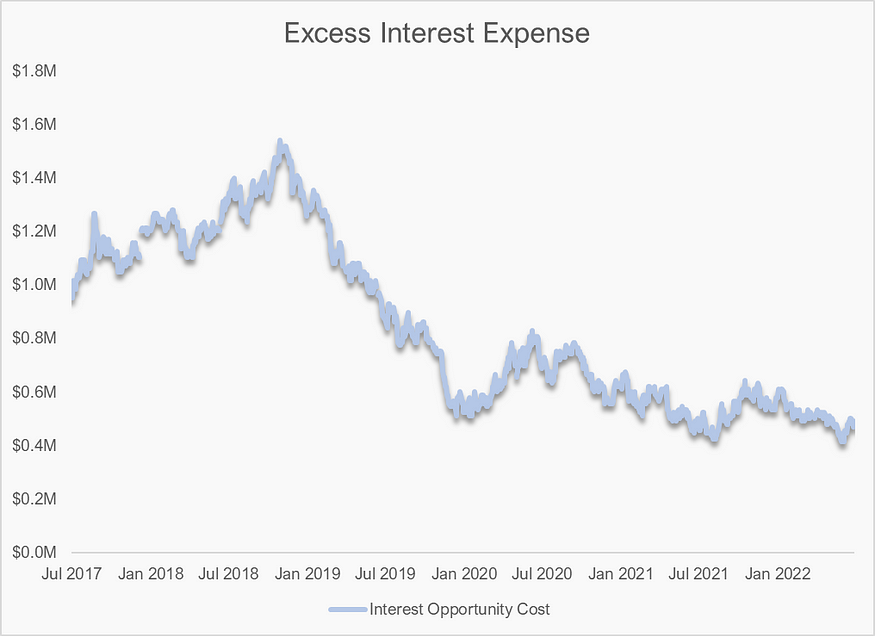
Average 5s-10s Spread: 0.78%
Average Excess Interest: $852K
Not quite as big of an impact as the prepayment penalty, but still no slouch in affecting the bottom line. This still cost us nearly a $1M on average, nothing you want to ignore when calculating what your IRR could have been.
Keep in mind that this chart is showing the excess interest you would have paid at the disposition date, so these value correspond to the rate you would have locked 5 years prior (i.e. the 2017 disposition was a result of rates locked in 2012).
The Combined Effect
Ok, so what’s the combined effect on our deal?
On average, simply closing a 10 year loan instead of a 5 year loan cost us an average of $4.1M, or 12.3% of our property value at close (assuming a 75% LTV). This is a leveraged product though, so what we really care about is that number relative to our original equity.
12.3% of Market Value / 25% Equity = 49.2% of our originally invested equity
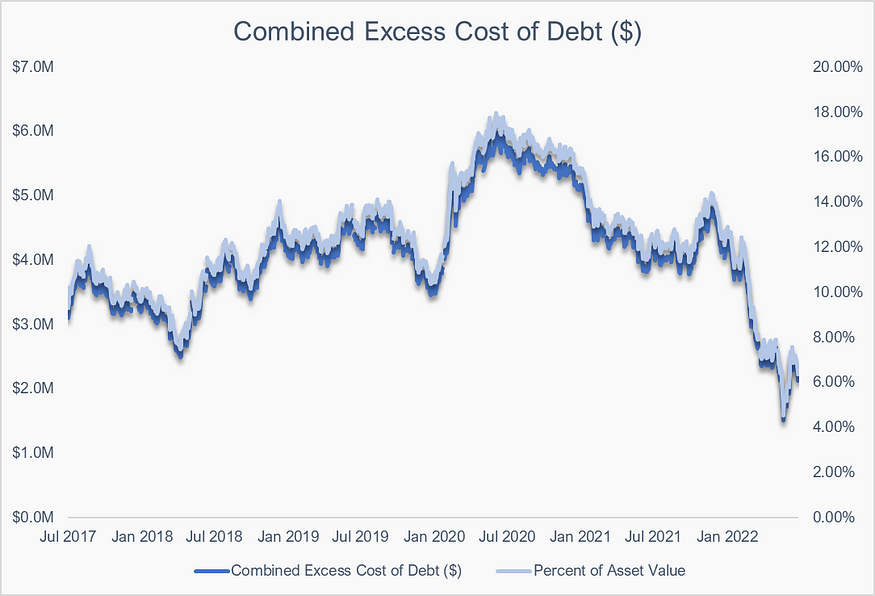
Keep in mind that this doesn’t even take into account the cost of the higher rate spread we would have paid.
Of course, the ultimate affect on our IRR will depend on our asset management practices and whether we were able to increase the value of our property, but this is still a pretty big hit on our ROE.
Wait a minute…
- What if I had actually held the asset for 10 years, isn’t the longer-term loan less risky?
Not really, there’s a reason banks borrow short and lend long, because you almost always win as the short-term borrower. It doesn’t matter whether you borrow over a floating rate, or borrow a 5x5 structure instead of 10 years, you win as the short term borrower most of the time.
Of course, this is just on average. There are opportunities when it makes sense to go ahead and lock rates for as long as possible, like when the 10T hit historic lows in 2020.
- Your data set only covers a limited time frame, that can’t be true historically.
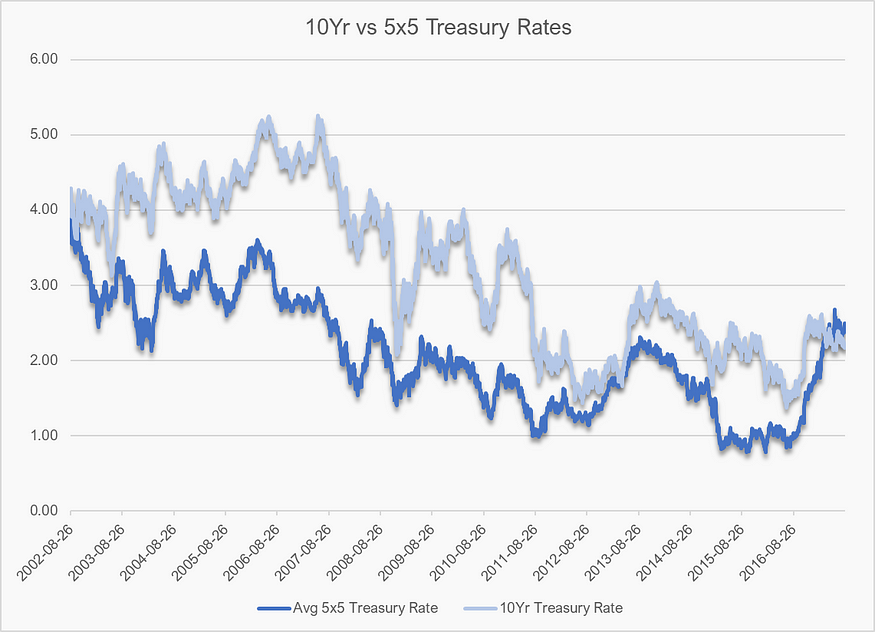
It’s held true for any period over the last 20 years. As an example, if we assume that we used two, 5-year loans back to back instead of a single 10 year loan and held it the entire time, you are almost always better off borrowing short. Even ignoring the difference in loan spreads, from 2002–2017 (the latest I can test this thesis through is 5 years prior to now), you would have been better off borrowing short 91% of the time, only losing 9% of the time. During the periods you won, you would have been better off by a borrowing spread of 1.18% (saving you >10% of the loan amount over the loan’s lifetime). During the small number of times you lost, you would have lost by an average of 0.14% (or <1.5% of the loan amount of the loan’s lifetime).
In fact, if we assume that the average 5yr loan spread is only 15bps lower than the average 10yr loan spread, then the number of times you lost would have all but disappeared.
Conclusion
While asset management is key to driving value in CRE, you can’t ignore the debt. In fact, implementing just a few simple debt management strategies can significantly improve your firm’s profitability and provide you with a competitive edge.
If you liked this article, consider following me and subscribing to email updates whenever I post an article. You can also follow me on Twitter or connect with me on LinkedIn.


