Infographic: Negative Leverage in 2022
A couple of weeks ago I wrote about what Negative Leverage is, and some strategies for managing it in the current market environment. Since…

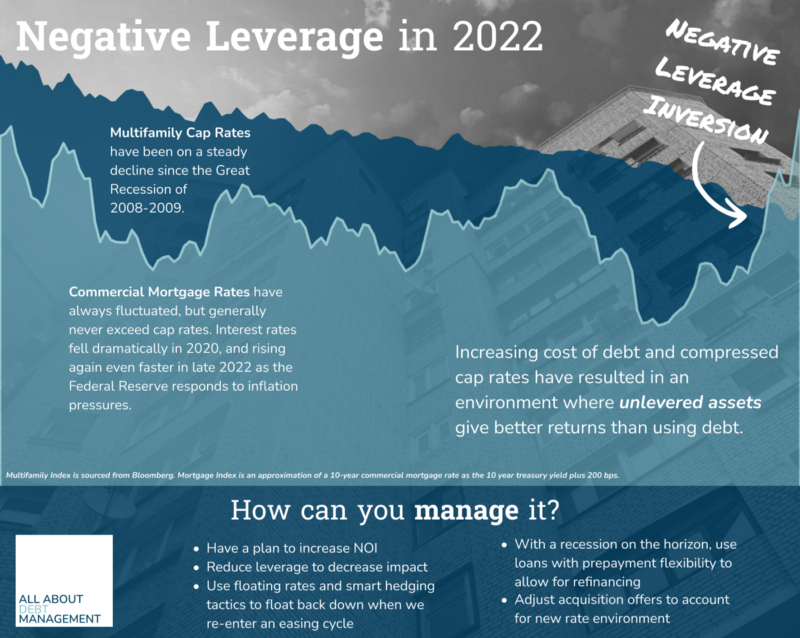
A couple of weeks ago I wrote about what Negative Leverage is, and some strategies for managing it in the current market environment. Since then, I’ve heard more chatter on the topic and decided to create the above infographic to illustrate suddenness and severity of the topic.
With the Fed implementing ZIRP for more time than they haven’t since the Great Recession, and a pandemic driving long-term yield down, cap rate compression continued to accelerate. Operators used high amounts of leverage to acquire cheap properties (relative to risk-free rates). It was easy to become complacent, buying properties as if rates would be low forever.
Inflation
Fast forward to 2022, and a “transitory” inflation trend turned out to be a little more permanent than economists initially believed. One of the two tenants of the Federal Reserve’s dual mandate is to maintain price stability, which they have historically interpreted as maintaining an inflation rate of about 2% per year. Their weapon of choice for combatting inflation is the Federal Funds Rate, where a small trading desk in NYC flexes its financial muscles and manipulates markets to maintain a target interest set by the FOMC board.
Over the course of 9 months, the Fed used a series of 75 bps rate hikes to create the steepest tightening cycle in US history, raising the target rate from effectively 0% to over 3%. They’ve also slowly unwound their balance sheet, putting upward pressure on long term rates at the same time.
This led to both short and long term rates rising in lock-step with one another.

Cap Rates
The strange thing is cap rates haven’t moved with rates, hence the whole negative leverage predicament. Granted, cap rates today were locked in 60 days ago, so the reaction would lag in response to rates, but I don’t think that’s the whole story.
One pref equity lender I spoke with said the only deals getting done were value-add — the borrower had a plan to grow themselves out of a negative leverage situation. Brokers and lenders alike are struggling to get deals done. But why?
If you’re a borrower that is approaching loan maturity, you have two options. First, you can try to refi the loan, but lenders are being very conservative now, both in valuation and leverage. So you’ve got to come up with cash to cover the difference. Second, you can try to sell, but at what price? Whoever’s buying is going to be facing the same dilemma as you.
Interest Rates
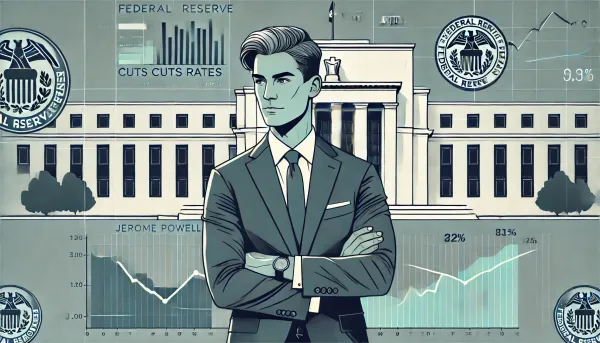
The “good” news for borrowers is that the Fed is usually forced to cut rates pretty soon after tightening. They’re very good at hiking the economy into a recession. If they do so, they’ll most likely be forced to cut rates again, bringing some relief and removing negative leverage. In fact, the market is already predicting rate cuts around April of 2023.

If the Fed cuts, it will likely be in response to recession indicators, like falling GDP, unemployment, or rapidly falling inflation.
Leading indicators show easing input prices on things like shipping costs, meaning inflation relief could be on the horizon, even if the Fed manages a soft landing.
Conclusion
This leads us to the question — who blinks first? We can’t live in a negative leverage environment forever. If rates remain elevated for a while, loan maturities will force CRE operators to take losses either by default or sale. If J. Powell & Co can’t hit a soft landing (which I doubt they can), significant rate cuts could offer relief to operators, if they’re prepared.
If you liked this article, consider following me and subscribing to email updates whenever I post an article. You can also follow me on Twitter or connect with me on LinkedIn.